Your trading copilot.Analyse together.
Research the market with AI, challenge your ideas and calculate risk. Show it what you look for before deciding.
No credit card ·
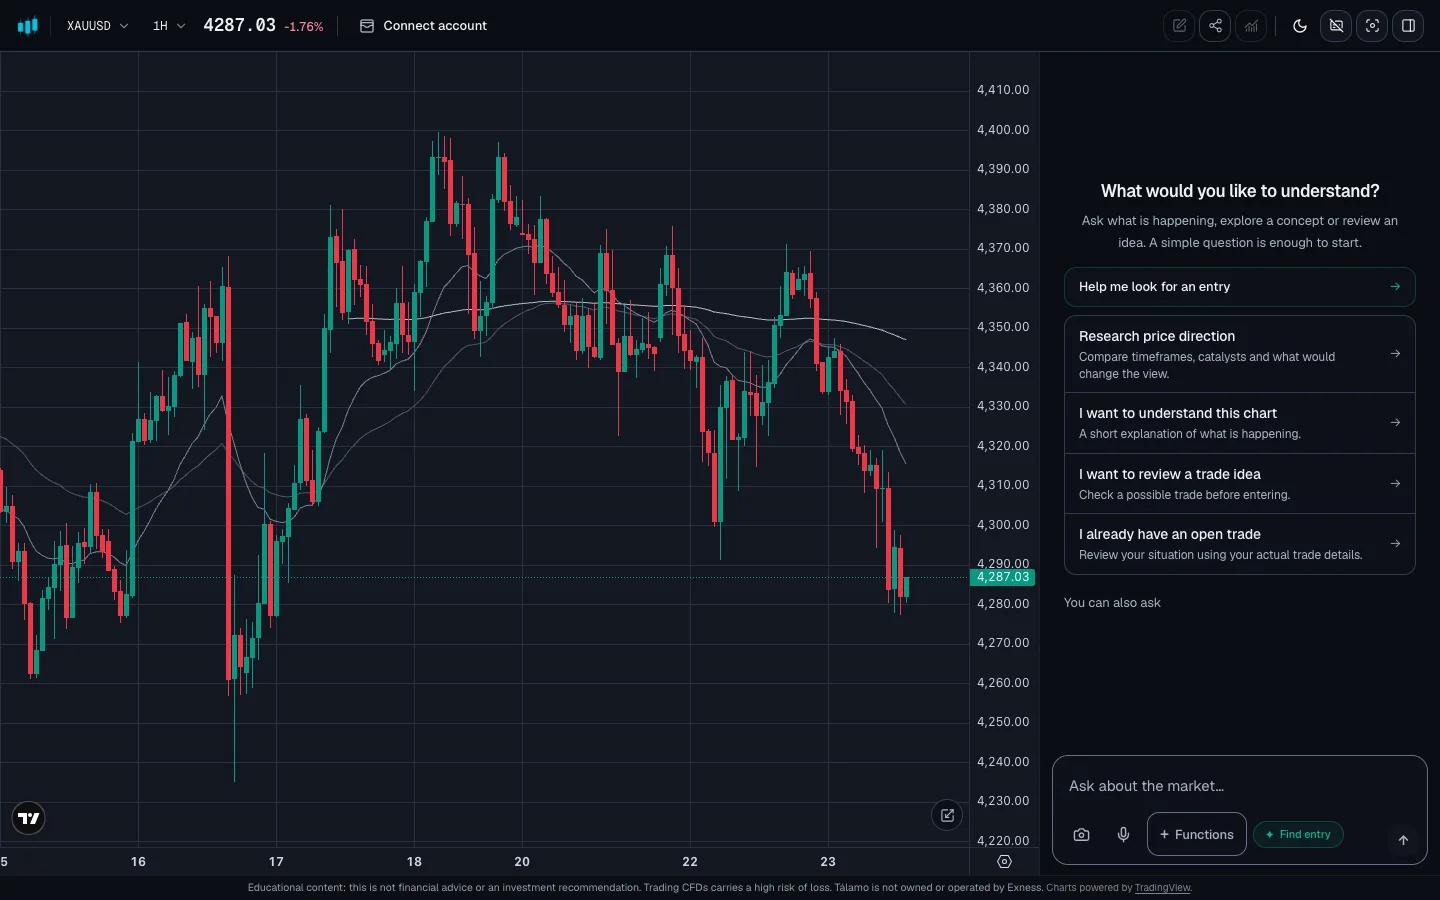
- Comparing chart patterns
- Reviewing structure and indicators
- Checking news and the calendar
- Reviewing the example’s criteria
- Preparing the analysis
Lost 4,300: head-and-shoulders top.
The example’s rule is met: the 1-hour candle closed below the neckline.
- Neckline
- 4,302
- Invalid above
- 4,372
- Projection
- 4,210
Pattern levels, not orders.

With data and technology from
Your question.The context.Your criteria.
01
Start with an idea.
Tell it what you’re seeing and what you want to understand.
I’m looking at a move down in gold. What supports this idea, and what would challenge it?02
Compare the structure.
Compare the chart with familiar patterns.
32 of 32H&S · 82% match03
Examine the conditions.
Moving averages, RSI and sessions to review the scenario.
- EMA 20 / 50
- bearish cross
- RSI 14
- 36
- Session
- New York
- Structure
- bearish BOS
04
Check the wider context.
News, events and data to challenge your analysis.
- Calendar
- 3 high-impact events
- Dollar
- firm against gold
- COT · CFTC
- big players long gold
- 10-year real yield
- +44 bp in a month
05
How do you analyse?
Bring your approach: Wyckoff, Price action, Fundamentals, SMC, Your own mix.Show it what you look for, what you wait for and why you reject an idea.
Your criteria
I wait for the candle to close before considering the breakout.
✓ Example rule06
Follow the reasoning.
Review the levels, the reasoning and what still needs checking.
Lost 4,300: head-and-shoulders top.
The example’s rule is met: the 1-hour candle closed below the neckline.
- Neckline
- 4,302
- Invalid above
- 4,372
- Projection
- 4,210
Pattern levels, not orders.
You have the data.Give it context.
Every time you ask, it checks the CFTC, the US Treasury and DTCC. You never open a file.
- CFTC· weekly
- US Treasury· daily
- DTCC· daily
- How are large traders positioned in gold?
Checked the CFTC COT report · Sep 15 CopilotCOT · CFTC · weeklyStill long: 230,338 contracts net.
56% of open interest. This week they let go of just 1,622.
Longer than in 62% of the last 156 weeks: upper half, far from the extreme.
- What changed in rates, and how does it relate to gold?
Checked the Treasury real yield curve · Sep 23 CopilotUS Treasury · dailyThe 10-year real yield rose 44 bp in a month.
Level1 month10-year real2.76%+44 bp2-year4.85%+68 bp10-year5.11%+47 bpOver 60 days, gold and that yield moved in opposite directions (−0.33): it weighs, but it doesn't explain everything.
- What move are these options pricing in?
Checked gold options on DTCC · Sep 23 CopilotOTC options · DTCC · dailyThe options market prices ±2.35%: 4,188 to 4,390.
1 wk 17.0% · 1 mo 21.4% · 3 mo 23.7%
It comes from the real premiums paid for gold options (Sep 23), not from an indicator.
Start with what you’re looking at.
COT for 16 markets: metals, oil, US indices, crypto and major currencies. Treasury yields, daily. Option expiries and volatility for currencies and gold.
Positioning, yields and options: real public data from the CFTC (Sep 15), the US Treasury (Sep 23) and DTCC (Sep 23, 2026). It's context, not a recommendation.
Return to your idea.Review what you did.
- How much am I risking at my stop?CopilotYour account + calculator
Estimated loss at the stop: 35 USD.
0.7% of your account, with 0.01 lots. Execution may vary.
- Are my positions concentrating the same risk?Connect your accountCopilotYour account · read-only
Yes: it's one single bet against the dollar.
Combined risk: 95% of the sum. Gold carries 93%.
By currency
- USD
- XAU
- EUR
- JPY
Move together
- XAUUSD · EURUSDadd up +0.69
- EURUSD · USDJPY (sold)add up +0.51
- Why did I take this trade?CopilotYour journal
Your note from Sep 12
“I enter if it breaks the Asian high.”
It didn't break. You entered anyway.
- When do my losses tend to happen?CopilotYour MT5 account · read-only
7 of your 10 losses: after 3 p.m.
That concentration is worth reviewing.
0h12h23h
What are you looking at today?
Illustrative example. Not data from a real account; the exposure uses real prices and correlations.
Risk warning
Trading CFDs carries a high risk of losing money rapidly due to leverage. You should consider whether you understand how CFDs work and whether you can afford the high risk of losing your money.
Past performance is not indicative of future results. This page does not constitute financial advice or an investment recommendation. Tálamo does not guarantee returns.